By Abhishyant Kidangoor

More than one-third of land on Earth — that’s about three times the size of Russia, the largest country — has vegetation whose canopy reaches a height greater than 1 meter, or 3 feet. Vegetation with a canopy higher than 5 m (16 ft) occupies another area about twice the size of Russia.
These are some of the highlights from a very-high-resolution (1-meter) map of canopy heights that can detect single trees at a global scale, in a development with massive implications for tracking biomass carbon storage.
Tech giant Meta and nonprofit organization World Resources Institute used high-resolution satellite imagery and cutting-edge artificial intelligence technology to gather the data and develop an open-source model that can estimate canopy height from satellite images as well as aerial data.
“We wanted to see how spatially granular we can get for canopy height data,” John Brandt, data science associate at WRI, told Mongabay in a video interview. “Our hope is to help in the monitoring of systems that aren’t well-served by forest structure data that currently exists in the Earth observation community.”

Meta and WRI collaborated to produce a global map of canopy heights that can detect single trees at a global scale. Image courtesy of WRI and Meta.
Mapping forests with the help of remote-sensing technology has made significant strides in recent years, especially with efforts to track and monitor deforestation around the world. However, detecting deforestation requires only relatively low-resolution imagery. That’s because deforestation typically occurs over larger areas and involves removal of bigger trees. Getting data on carbon storage requires more nuanced information, such as the dimensions of trees, as well as data on younger trees and sparse vegetation spread over larger areas.
“If you look at traditional forest carbon data, it makes sense for some kinds of forests,” Brandt said. “If you are looking at an agroforestry system or a dryland forest or a really heterogeneous forest, it won’t tell you much about carbon storage because, well, it doesn’t tell you the canopy height within a pixel.”
Canopy height is an important indicator of forest biomass, biodiversity richness and aboveground carbon stock. It’s also a significant factor used to monitor and measure the progress of forest restoration efforts. “In cases where land was previously degraded, and we start from zero canopy height, the change over time can be quite dramatic in a few years,” Jamie Tolan, research scientist at Meta, told Mongabay in a written interview. “Being able to see an increase in canopy height can serve as evidence that forests are growing and that interventions have been successful.”
To gather the data and train the model, the team used 18 million images gathered from high-resolution satellites owned by Maxar Technologies. With the data collected, the team built a foundational AI model, one that’s trained on a broad data set and that can later be adapted for different applications. The popular ChatGPT, for instance, is a foundational AI model trained on a global data set that can be used to design customized chatbots. “We are doing the same thing where you don’t have to retrain 99% of the model,” Brandt said. “You can just train a really small model on the target imagery that you want to analyze.”
The process of training the model consisted of two steps: first, a self-supervised learning stage, where the model trained itself using the input data; followed by a fine-tuning stage where the team fed the model publicly available lidar data on canopy heights in the United States. In the second stage, “the model is essentially shown an RGB image of a region, and the corresponding lidar height map, and it learns the relationship between the two,” Tolan said.
The model can now take in high-resolution satellite data or aerial data. It then goes on to predict canopy height per pixel in the input image.
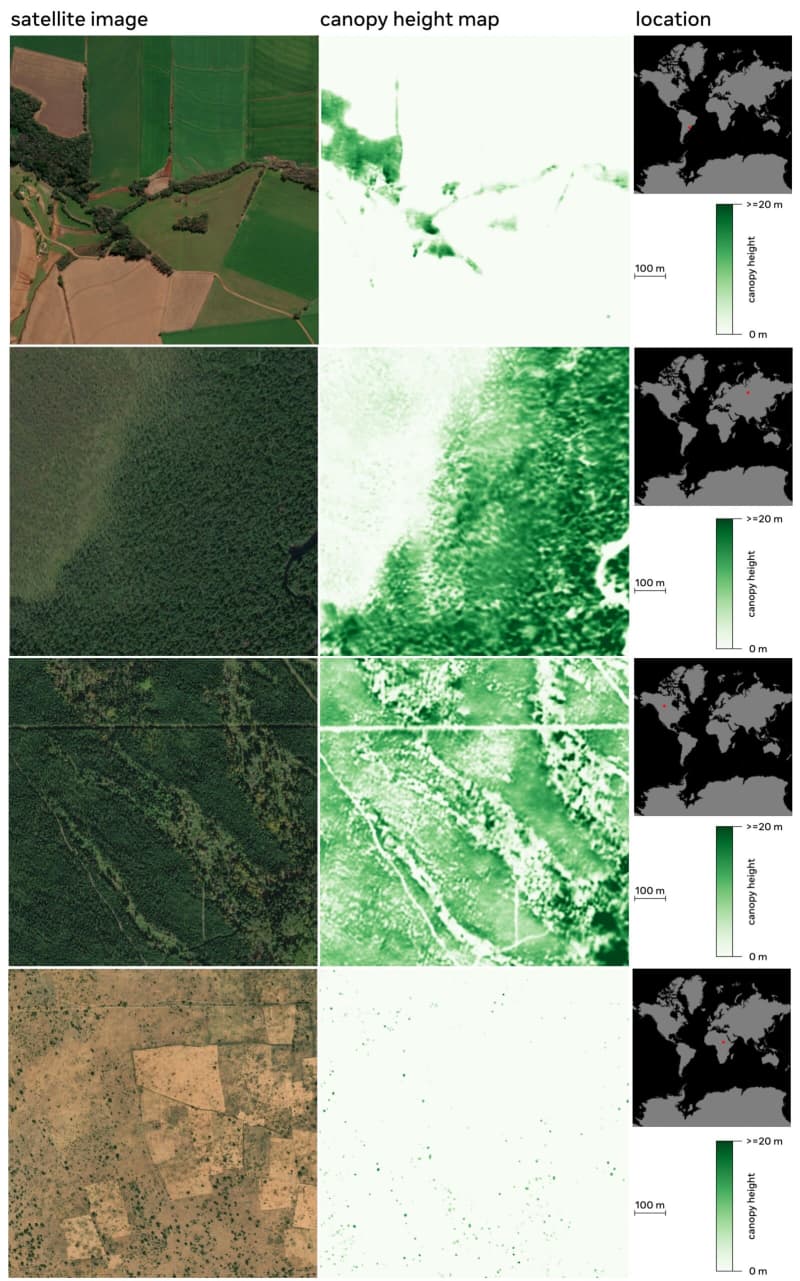
The foundational AI model built by WRI and Meta can analyze satellite and aerial images and estimate canopy height per pixel in the input image. Image courtesy of WRI and Meta.
Brandt said both the model and the global map the team produced can be used in different applications. “You can use the map where the existing data is of good quality,” he said. “Where it’s not, you can use the model. You can take field data and, with 10 or 15 field data points, train the canopy height model to get really good predictions.”
The team used the model to develop canopy height maps for California in the U.S. and São Paulo in Brazil. According to the team, the model was found to perform well in Brazil, even though the training data came from North America.
They were also able to get insights from areas where data have been sparse.
“One area that has been surprising are pockets of forest at the transition from taiga to tundra where good maps and past canopy estimates have been scarce,” Tolan said. “We are also interested in trees outside of forests, for instance in Africa, which have been an area of active research in understanding the carbon potential of forests.”
Brandt said the team is now trying to figure out how ramping up computational power further could improve the quality of the data. “We want to understand if computing is the solution or if better model design is the solution,” he said.
The team also plans to update the model as well as the map when new data become available. This could potentially also involve retraining the model to estimate other measures.
“If you want to get to carbon, canopy is half the question. The other half is what is the stem density?” Brandt said. “It’s still in the research phase, but we are working to jointly predict canopy height and stem count as well.”
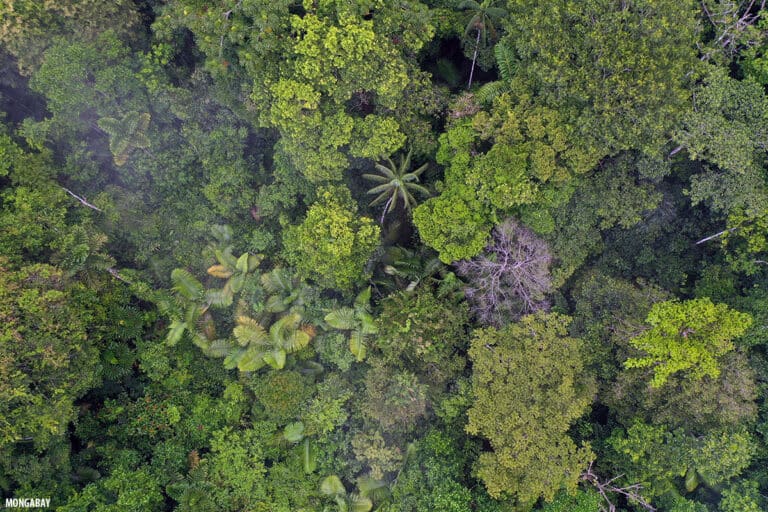
Banner image: Rainforest in the Colombian Amazon. Image by Rhett Butler.
Abhishyant Kidangoor is a staff writer at Mongabay. Find him on 𝕏 @AbhishyantPK.
This article was originally published on Mongabay