The US dollar index (DXY) and the price of gold retreated slightly after the Federal Reserve interest rate decision. The dollar moved from last month’s high of $106.50 to $105.70. It remains about 5% above its lowest point this year.
US nonfarm payrolls ahead
Gold, on the other hand, has retreated from last month’s high of $2,432 to $2,320. Like the US dollar, gold remains significantly higher than the year-to-date low of $1,985.
The main catalyst for the price of gold and the US dollar index was the Federal Reserve decision on Wednesday. In it, the bank decided to leave interest rates unchanged between 5.25% and 5.50% as was widely expected. It was the sixth month that the bank did that.
The bank justified the continued pause to the fact that inflation is the biggest thorn in the flesh in the economy. Evidence shows that inflation has stopped falling. The Consumer Price Index (CPI) rose to 3.5% in March while the Personal Consumption Expenditure (PCE) rose to 2.5%.
Still, the Federal Reserve pointed that it will likely not hike interest rates this year since there are signs that the economy is softening. A report by the Institute of Supply Management (ISM) showed that the country’s manufacturing PMI dropped to 49.2 in April from 50.3 in the previous month.
There are also signs that the labor market is cooling. A report by the Bureau of Labor Statistics (BLS) revealed that the number of job vacancies in the US dropped from 8.81 million in February to 8.48 million in March. Consumer confidence also plunged in April.
Looking ahead, the next important catalyst for the US dollar index and gold will be the upcoming US nonfarm payrolls (NFP) data scheduled for Friday. These are crucial numbers because they form a crucial part of Federal Reserve’s dual mandate.
The average estimate among analysts is that the economy created 243k jobs in April after creating 303k in March. The unemployment rate is expected to come in at 3.8% while wage growth will remain at 4.1%.
Gold price forecast

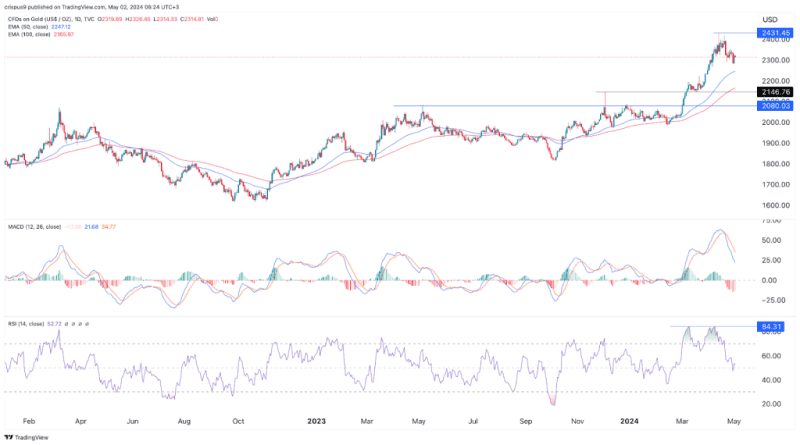
The price of gold has pulled back in the past few days. It has retreated from this year’s high of $2,431 to $2,314 as the rally took a breather. It is common for assets that are soaring to pause and pull back.
Gold price has remained above the 50-day and 100-day Exponential Moving Averages (EMA). At the same time, the two lines of the MACD have formed a bearish crossover. The Relative Strength Index (RSI) has moved from the overbought level of 84 to 52.
Therefore, gold will likely bounce back this month and possibly retest the highest point this year since fundamentals are still strong. US debt is rising, the bond market is imploding, and demand from China is rising.
DXY index forecast

The US dollar index has moved sideways in the past few days. It has formed a bullish flag indicator, which is a popular sign of continuation. The index also formed an inverse head and shoulders pattern and a golden cross.
Golden cross is a pattern that forms when the 50-day and 200-day moving averages make a bullish crossover. It has moved above the crucial support level at $104.96, its highest swing on February 14th.
Therefore, the outlook for the index is bullish, with the next point to watch being at $107.35, its highest swing in October. This view is supported by the fact that banks like the ECB and Bank of England will start cutting rates earlier than the Fed.
The post DXY index and gold price forecast ahead of US NFP data appeared first on Invezz