As new cases of the coronavirus rise in India; the growth of infections is outpacing growth in testing – tests have doubled since April but cases have leaped fourfold. Here are some graphs that show how India is battling the pandemic.
By Dayawanti Punj and Nikita Soni
Coronavirus is continuing its spread across the world and India is no exception.
The country of 1.3 billion people had reported its first corona positive case in Kerala, a southwestern coastal state of India on January 30, when a medical student studying in China tested positive for the infection.
Since then, India has consistently seen a rise of cases — the total tally of COVID-19 infections in India crossed a mark of 1,00,000 in 65 days on May 18 and over 2,00,000 in just another 15 days on June 3, when the death toll stood at 6,091.
But on the brighter side, over 1,00,000 people or 48% of those infected with COVID-19 could beat the deadly virus so far.
Though lockdown and sealing inter-state as well as international borders delayed the spread of the virus in the country, however, if data is anything to go by, despite a series of four stringent lockdowns, the cases in the country have consistently gone up. Besides rapid spread, this could also be attributed to our expanded testing capacity, which was increased from 1,400 tests being conducted daily during Lockdown 1.0 to over 1,00,000 tests every day during the current phase of Unlock 1.0.
However, given the contagious nature of the virus and ease in lockdown restrictions, India now is at the seventh spot among the nation’s worst hit by the COVID-19 pandemic after the US, Brazil, Russia, UK, Spain, and Italy.
Now, as India enters Unlock 1.0, a gradual easing out of the pandemic-induced lockdown here’s a quick look at the pandemic progression since its outbreak in the country through a series of graphs and charts.
1. The curious case of India’s low case fatality rate
India’s COVID-19 case fatality rate (CFR) has been much below the world average of 6.6%. In fact, according to the Coronavirus Resource Center at Johns Hopkins University, India’s CFR is among the lowest – 2.8% as of May 28, which is one-eighth to that of Belgium- the country that currently has the highest CFR (16.2%).
According to this analysis, high-income countries have reported a higher number of COVID-19 deaths as compared to lower-middle-income countries such as Indonesia, India, Nepal, and Pakistan.
Also, this suggests that the countries reporting a higher CFR also perform a much greater number of tests (measured in terms of tests conducted per day per million members of the country’s population) than countries with low CFR.
Furthermore, the graph above indicates that either the relatively poorer countries may not be testing the deceased for COVID-19 or they may be undercounting them due to comorbidities.
2. Maharashtra battles with the highest number of COVID-19 cases in India
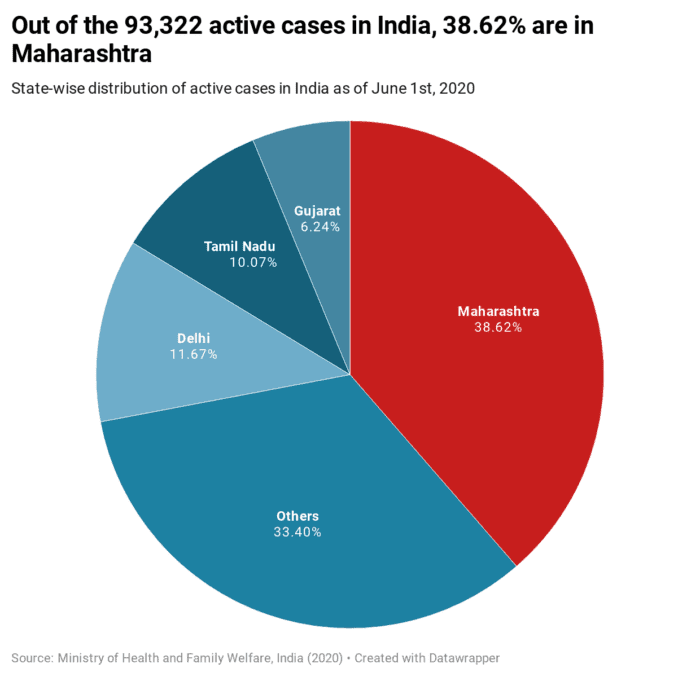
The growth in the number of infections has been different in different states of the country.
With over 40,000 active cases of novel coronavirus as of June 4, Maharashtra has crossed the 74,000-mark, as it remains to be the worst-affected State in the country.
Mumbai, the financial capital of India remains to be the hardest hit city in the State, followed by Pune, Aurangabad, and Solapur, respectively.
Tamil Nadu, with over 24,000 corona cases, ranks second. National Capital Delhi has also climbed up to third place reporting over 23,000 cases of COVID-19 infection.
Meanwhile, Maharashtra has also reported a maximum of 2,587 deaths so far.
3. Improvement in recovery rate
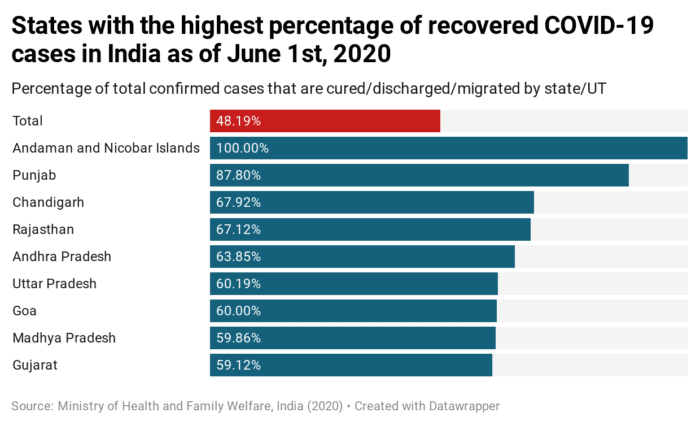
As India enters into the current phase of Unlock 1.0 from June 1, the country’s recovery rate stands at about 48%.
While many states and union territories have reported a recovery rate of over 50%, Andaman and Nicobar Islands has reported a recovery rate of 100%, Punjab 85%, Goa 72%, Chandigarh 71%, and Rajasthan 70%.
Improvement of recovery rate – from 26.59% on May 2 to 48% on June 1, has been attributed to various factors such as ramping up of testing infrastructure, effective contact tracing, and strict lockdown measures, etc., by the State as well as the Central governments.
4. COVID-19 infected 33.2 people per million in India
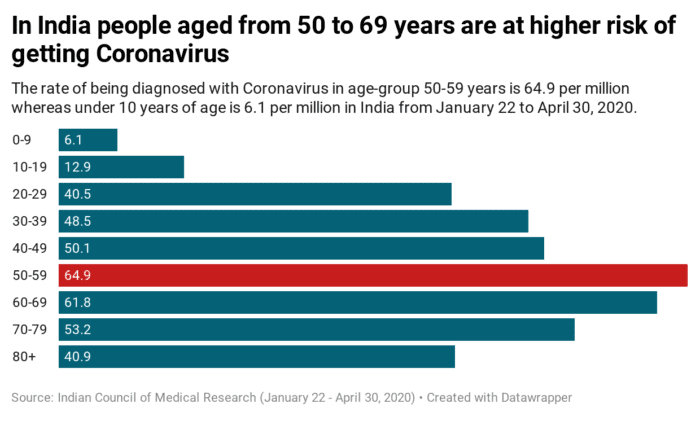
According to the recent data released by the Indian Council of Medical Research (ICMR), it has been estimated that in India only 0.00332% or 33.2 people per million population are infected with the novel virus.
This is considerably lower than the attack rates in other countries such as the US (0.2523%), France (0.3364%), UK (0.1962%), and Canada (0.0899%), according to the US National Library of Medicine.
The data from January 22 to April 30, 2020, further indicates that the attack rate or the percentage of the population that contracts the disease in an at-risk population during a specified time interval, has been the highest in age-group 50-59 years — 64.9 per million, and the lowest under 10 years — 6.1 per million, in India.
Further, people above 50 years with pre-existing medical conditions (like diabetes, hypertension, etc) are reported to be more susceptible to some of the dangerous effects of coronavirus and are at higher risk of dying from the deadly virus.
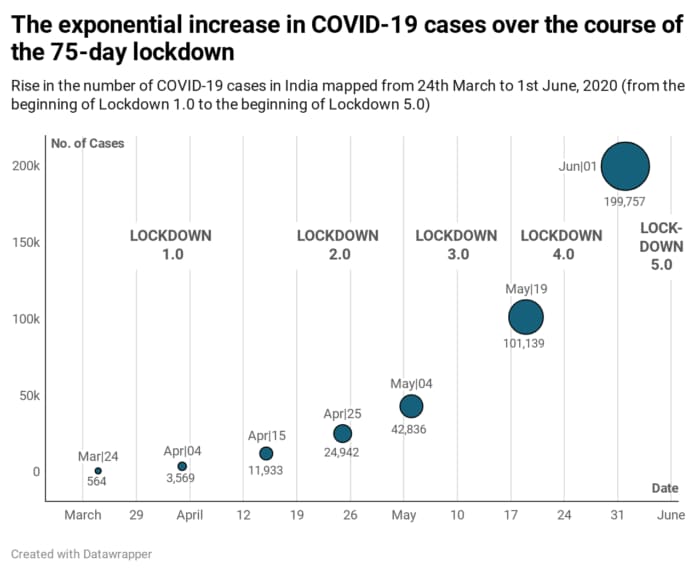
5. From Lockdown 1.0 to Unlock 1.0 – efficiency of lockdown phase-wise
The graph above explains how COVID-19 gripped India even during a nationwide lockdown.
Starting with a ‘test lockdown’, a 14-hour voluntary curfew on March 22, the Government of India had imposed and extended a series of subsequent lockdowns in the country to prevent the spread of the pandemic.
When the Lockdown 1.0 was imposed for 21 days, the total number of confirmed COVID-19 cases in India stood at 512.
Also, the first phase of lockdown restricted all movement of individuals and vehicles in the country.
However, during Lockdown 2.0, which started from April 25, the option of a conditional relaxation was announced for regions where the spread had been contained or was minimal. The confirmed cases during this phase of lockdown stood at 17,656.
Later, on May 1, the nationwide lockdown, or Lockdown 3.0 was extended by two more weeks. The country was now divided into three zones depending on the containment of the virus — green, red, and orange.
However, during this phase of lockdown, the delivery of essential items was allowed, along with a few other relaxations in non-containment areas.
With states easing out restrictions during Lockdown 4.0, India crossed a mark of one lakh corona positive cases.
During this phase of lockdown, private vehicles, buses with 20 passengers, cabs, auto-rickshaws, etc., were allowed. All markets and shops were opened on an odd and even basis but malls, schools, colleges, cinema halls, bars, hair salons, and spas still remained closed.
The current phase of re-opening, Unlock 1.0, which began on June 1, is aimed at reviving economic activities at the State level.
While the government is preparing to gradually lift restrictions, the confirmed cases in the country have mounted to 217,541 as of June 4.
With inputs from Nabeela Khan.