Google’s community mobility data shows that Lockdowns 1.0 and 2.0 were most effective, and some states with lower levels of mobility in the initial days helped in flattening the COVID-19 curve.
By Anuja Venkatachalam
In an effort to aid governments in abating the COVID-19 pandemic, Google launched the COVID-19 Community Mobility Report that makes public large volumes of anonymised and aggregated data from its users which can be used to gauge the movement of people in light of the social distancing measures implemented by governments in an effort to control the spread of COVID-19.
This has been welcomed as another step-forward towards enabling governments to harness the power of technology in policy implementation.
Drawing from data collected through Google’s GPS-linked applications including Google Maps, the Community Mobility Report is able to estimate visits to public places such as grocery stores, pharmacies, public transit points, parks, and recreational facilities during the COVID-19 pandemic.
Individual data collected from users is anonymised and aggregated at the state and national levels and presented as a change in mobility from a baseline measure of mobility estimated by taking the median of values observed daily from 3 January 2020 to 6 February 2020. The resulting metric, therefore, estimates the percentage change from the baseline value collected as of 6 February.
Regions with negative values convey a large drop in social mobility, whereas those with larger values indicate great outdoor movement during the pandemic.
Mobility is measured for set categories of public places, that include groceries and pharmacies, parks, retail and recreational places, workplaces, transit stations, and residential places.
Four phases of lockdown, and the gradual easing of restrictions:
India was one of the few countries to enforce early measures to contain the spread of the virus. When the first nation-wide lockdown (1.0) was enforced on 24 March 2020, there were only 519 confirmed cases of COVID-19, ~8% of whom were foreign nationals.
Subsequently, the country went into three additional phases of a national lockdown with limited relaxations permitted by individual states. Lockdown 2.0 came into effect on 15 April 2020 and extended to 19 days, followed by Lockdown 3.0 and 4.0 coming into effect on 4 May 2020 and 18 May 2020, respectively.
After over 90 days of lockdown, India gradually reopened after 1 June 2020. Unlock 1.0 saw the reopening of places of worship, shopping malls, and restaurants in some states.
Unlock 2.0 eased domestic travel and largely contained lockdown restrictions to containment zones. Unlock 3.0 further eased restrictions for gymnasiums and social gatherings, although it is still uncertain when educational institutions will reopen. States such as Maharashtra, Tamil Nadu, and West Bengal however, haven’t flattened the curve and continue to enforce a strict lockdown.
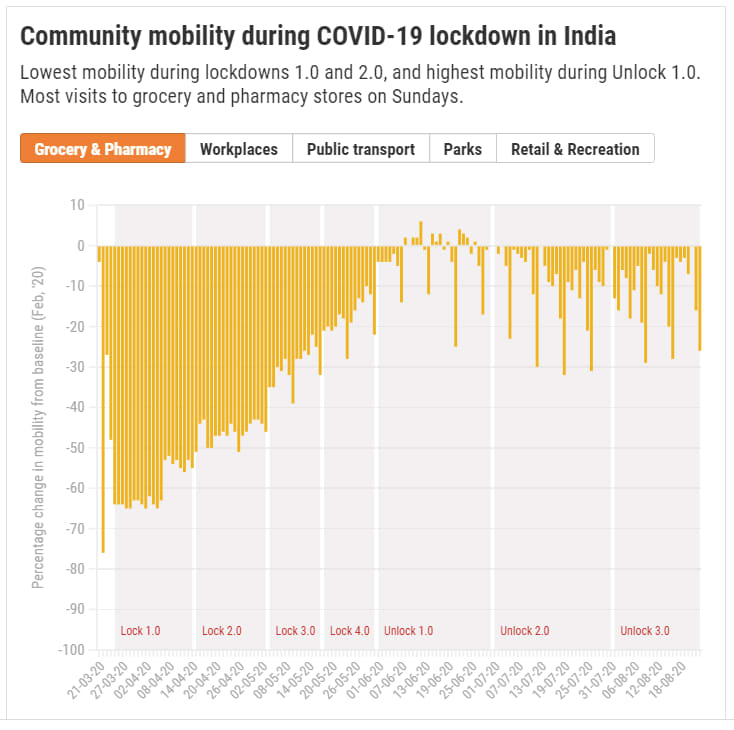
Visits to public places during COVID-19
Google’s community mobility data shows that the highest drop-in visits to public places was recorded towards the end of Lockdown 1.0, and the start of Lockdown 2.0.
The interactive graph below shows the change in mobility for different categories of public places during the course of the pandemic.
There was an average drop of ~64% points in community mobility during Lockdowns 1.0 and 2.0.
Retail outlets and places for recreation were hit the hardest with average drop-in visits by ~70% from February 2020 to August 2020, and parks saw a 55% drop in visits.
Grocery stores and pharmacies were predictably least affected.
Albeit a 25% drop in visits during the pandemic, they eventually received more visitors than at baseline, as observed in the spike in numbers during Unlock 1.0.
The data also shows spikes in visits to public places on Sundays, and to workplaces during the week.
Lower initial mobility associated with a smaller percentage increase in cases among Top 6 states with the most number of confirmed cases of COVID-19
Delhi currently ranks six in terms of the total number of confirmed cases of COVID-19 since the beginning of the pandemic. However, as is evident from the mobility data and the data on active cases, it recorded the largest drop in mobility (by 63.3%), particularly in the initial stages of the lockdown.
Its average daily percentage increase in active cases is currently at 4.8%, compared to Tamil Nadu’s 8.4% and Andhra Pradesh’s 7.5%.
These states did not record a drop in the mobility of the magnitude recorded in Delhi or Uttar Pradesh. Tamil Nadu’s current average drop in mobility is only 44%, and Andhra Pradesh’s is 43%, nearly 20% points above Delhi.
Meanwhile, Maharashtra’s drop-in visits to public places was closer to Delhi’s (~an average drop by 59.5%), and its average daily percentage increase in active cases is currently marginally higher than in Delhi’s at 5.51%.
Google Mobility data is only an estimate for mobility and not a primary measure of mobility. It must, therefore, be interpreted within the confines of its limitations.