GoodRX (GDRX) filed their S-1 earlier this week. I read It so you don’t have to (but you should). Here’s a thread on what I found interesting, fascinating and down-right incredible from the company. I’m starting at zero. Follow along here.
Q2 2020 hedge fund letters, conferences and more
GDRX Facts & Figures
- # 1 most downloaded medical app
- 4.9M Monthly Active Users
- 80%+ Repeat Activity
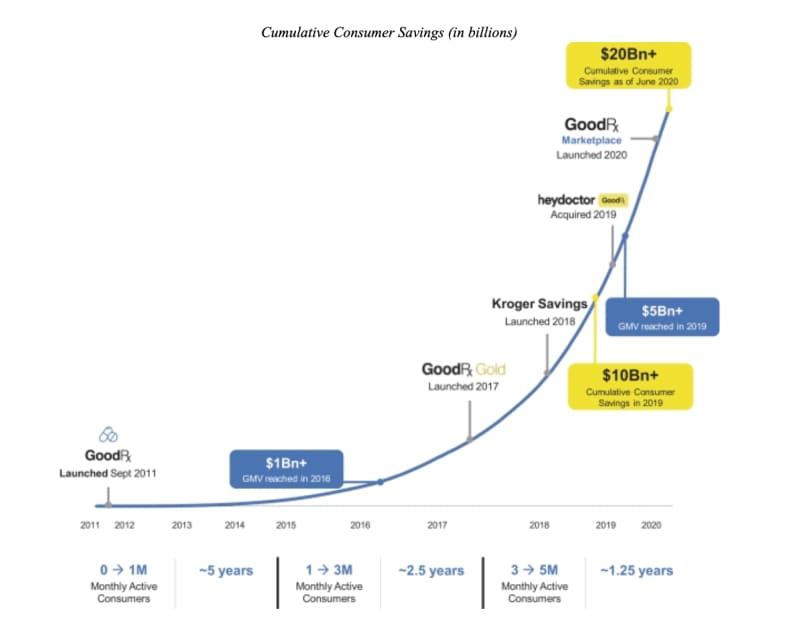
- $20B+ in Consumer Savings
- 150B daily pricing data points
- 4 platform offerings
- Est. Market Cap: ~$9.9B

Business Overview
Mission: To help Americans get the healthcare they need at a price they can afford.
So far it’s working (really) well.
The company estimates 18M of their customers could NOT have afforded to fill their Rx without the company’s savings tools.

How GoodRX Makes Money
Receives fees from partners, which is mostly Pharmacy Benefit Managers (PBMs) when customer uses GDRX code.

Financial Results
- GMV via prescription offering: $2.5B
- Compounded annual revenue growth rate: 57% since 2016
- Generated $388M Revenue in 2019
- Generated $66M Net Income in 2019
- 2019 Adj. EBITDA: $160M

Solving Healthcare Consumer Issues
- Lack of Consumer-focused solutions
- Lack of Affordability
- Lack of Transparency
- Lack of Access to Care
- Lack of Resources for Healthcare pros
GDRX Total Addressable Market
- $524B Prescription Care
- $30B Pharma manufacturer solutions
- $250B Telehealth

The GoodRX Value Proposition

What Makes GoodRX Different
1. Leading platform
2. Trusted Brand
3. Scaled & Growing Network
4. Consumer-focus
5. Extensible Platform
6. Cash generative monetization model

Analyzing Income Statement

- EPS grew from -$0.11 to $0.19 in four years (w/ growing share count)
- 2019 EPS of $0.19 is computed using weighted average shares post-IPO.
- Six-month ended YoY: $0.09 vs. $0.15 in 2020 on $15M more income
- SBC: <1% of revenues

Analyzing Balance Sheet

- <1YR: $41M
- 1-3YR: $85.6M
- 3-5YR: $82.7M
- >5YR: $711M
GDRX Key Operating Metrics


Where Will Future Growth Come From?

Recap: How To Track GDRX Bull Thesis
Meet The Founders (Letter Analysis)
Thinking About GDRX Valuation
GoodRX (GDRX) filed their S-1 earlier this week. I read It so you don’t have to (but you should). Here’s a thread on what I found interesting, fascinating and down-right incredible from the company. I’m starting at zero. Follow along here.
GDRX Facts & Figures
- #1 most downloaded medical app
- 4.9M Monthly Active Users
- 80%+ Repeat Activity
- $20B+ in Consumer Savings
- 150B daily pricing data points
- 4 platform offerings
- Est. Market Cap: ~$9.9B

Business Overview
Mission: To help Americans get the healthcare they need at a price they can afford.
So far it’s working (really) well.
The company estimates 18M of their customers could NOT have afforded to fill their Rx without the company’s savings tools.

How GoodRX Makes Money
Receives fees from partners, which is mostly Pharmacy Benefit Managers (PBMs) when customer uses GDRX code.

Financial Results
- GMV via prescription offering: $2.5B
- Compounded annual revenue growth rate: 57% since 2016
- Generated $388M Revenue in 2019
- Generated $66M Net Income in 2019
- 2019 Adj. EBITDA: $160M

Solving Healthcare Consumer Issues
- Lack of Consumer-focused solutions
- Lack of Affordability
- Lack of Transparency
- Lack of Access to Care
- Lack of Resources for Healthcare pros
GDRX Total Addressable Market
- $524B Prescription Care
- $30B Pharma manufacturer solutions
- $250B Telehealth

The GoodRX Value Proposition

What Makes GoodRX Different
1. Leading platform
2. Trusted Brand
3. Scaled & Growing Network
4. Consumer-focus
5. Extensible Platform
6. Cash generative monetization model

Analyzing Income Statement

- EPS grew from -$0.11 to $0.19 in four years (w/ growing share count)
- 2019 EPS of $0.19 is computed using weighted average shares post-IPO.
- Six-month ended YoY: $0.09 vs. $0.15 in 2020 on $15M more income
- SBC: <1% of revenues

Analyzing Balance Sheet

- <1YR: $41M
- 1-3YR: $85.6M
- 3-5YR: $82.7M
- >5YR: $711M
GDRX Key Operating Metrics


Where Will Future Growth Come From?

Recap: How To Track GDRX Bull Thesis
Meet The Founders (Letter Analysis)
Thinking About GDRX Valuation
The post GoodRX (GDRX) S-1 Breakdown Analysis appeared first on ValueWalk.
