You are—face it—a bunch of emotions, prejudices, and twitches, and this is all very well as long as you know it. Successful speculators do not necessarily have a complete portrait of themselves, warts and all, in their own minds, but they do have the ability to stop abruptly when their own intuition and what is happening Out There are suddenly out of kilter. ~ Adam Smith, “The Money Game”
Good morning!
In this week’s Dirty Dozen [CHART PACK]* we look at qualitative and quantitative sentiment signals, dive into [gold](https://www.valuewalk.com/gold-price/)’s recent fall and explore what it means\. Pour over a key ratio chart that gives a bullish signal, discuss consensus earnings estimates that are still too low. And end with some talk on buybacks, GBP risk-reversals, very* exotic data, and pitch a mismanaged beaten down travel stock that just might be about to turn\.
Let’s dive in.
More Bullish Headlines
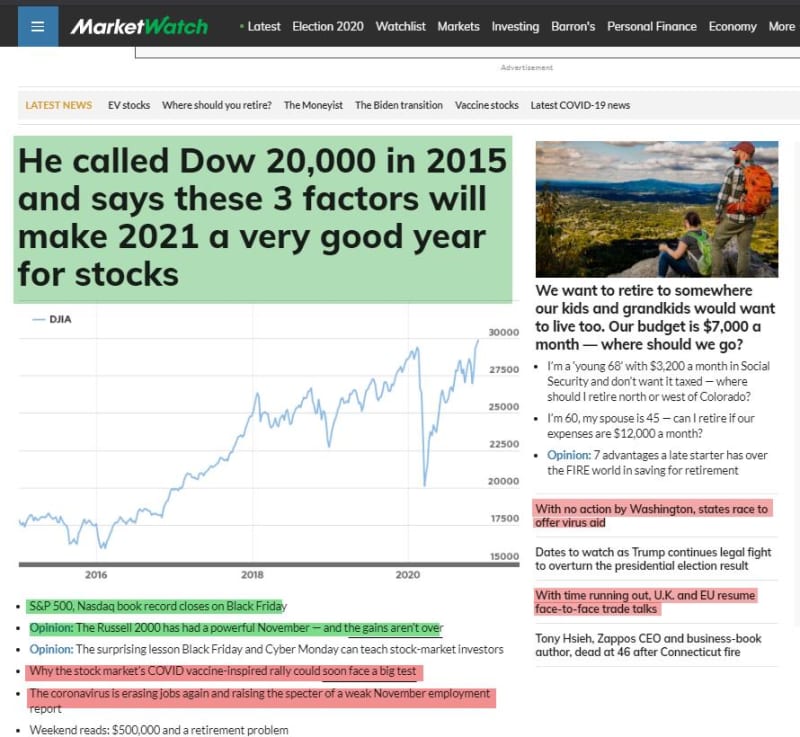
1. I have a few qualitative sentiment gauges that I like to routinely check. My three favorite are MarketWatch’s Homepage and Most Read articles banner, Bloomberg’s Real Yields show on Fridays, and CNBC’s Fast Money (just the first and last few minutes of the show).
You can see narrative adoption progress in real-time with these. Take MarketWatch’s Homepage below, for example. The green highlights are bullish article headers and the red bearish. We’re seeing more green (bullish) headlines than just a week or two ago. But… expect this page to be marked in nearly ALL green by the time this rally is good and done. That’s typically how the sentiment cycle swings.
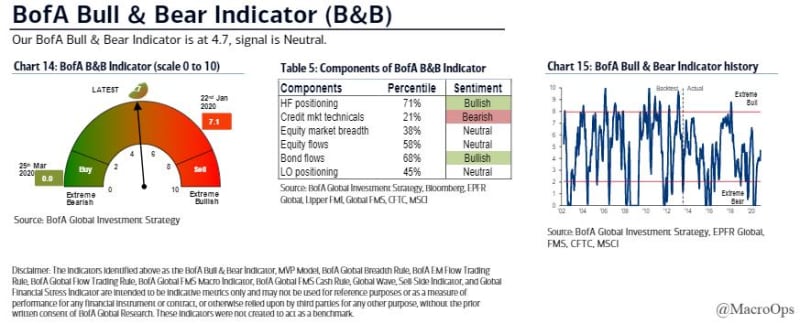
1. The BofA Bull & Bear Indicator, one of my favorite aggregate sentiment / positioning indicators is still neutral.
[Bonus: Successful trading and investing requires effective contrarianism\. Check out my free “Play The Player” report on how to read market sentiment and play the game at the 2nd level and beyond](…
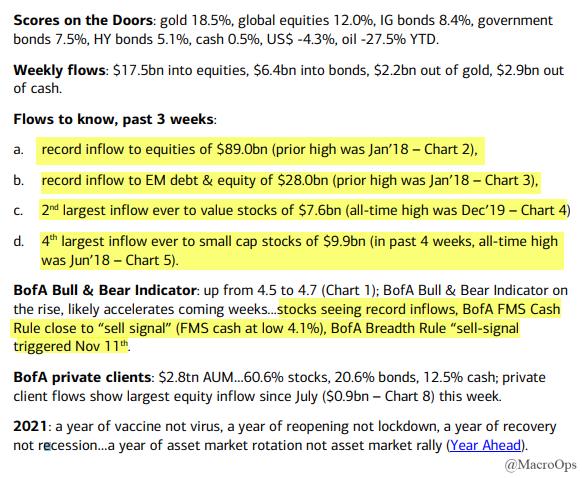
1. I’m of the opinion that we’re probably setting up for a rocky start to 2021. BofA’s Scores on the Doors show record inflows into equities, EM equities, EM debt, 2nd largest-ever inflows into value, 4th largest into small-caps, and their Cash-Rule close to giving a sell signal.
My base case is that we’ll see a fast climb into January causing positioning to catch up to sentiment leading to an eventual unwind starting mid-Jan and lasting a few months. I expect the correction to be more sideways than down unless we see long-end yields spike more than expected.
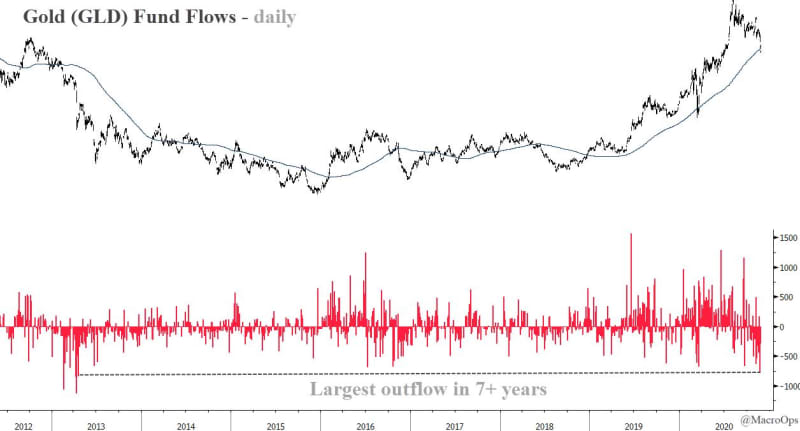
The Correction In Gold
1. Gold (GLD) saw its largest daily outflow in over 7-years last week. Gold is working off the technical overextension + crowded positioning that I pointed out back on August 7th (link here). When gold has been this extended in the past (over 25% above its 200dma) it has seen an average correction of 26%, with a minimum 14% and maximum 45% drawdown. It’s currently down approx. 15% from its August peak.
It’s closer to the end than it is to the beginning of this correction. But it likely won’t bottom until it hits its next major support level in the 1,675 -1,750ish range.

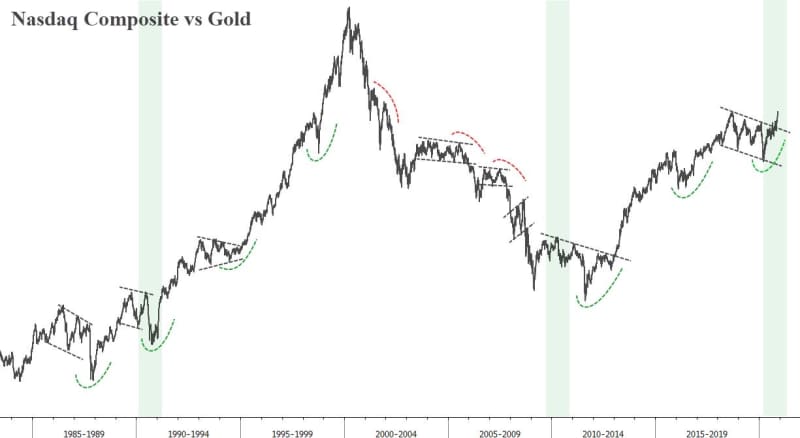
1. I like ratio charts. The good ones are a picture worth more than a thousand words… Equity index vs pet rock (gold) is one of my favorites. It tells you all you need to know about evolving investor psychology, flows, and positioning.
The green areas below mark the start of new bull markets following a bear and recession. This ratio chart is following a path similar to that seen at the start of the last two major bull cycles. Something to chew on if you’re in the camp that thinks stocks can’t or won’t rise much higher…
1. Big picture breadth charts confirm this cyclical bull take. @stageanalysis tweeted last week “Potential Major Market Breadth signal that the bull market is still only just beginning. The 80%+ level has only been reached twice before in June 2003 & August 2009 as you can see attached. So although in the upper risk range. A major sign of strength.”
3Q Earnings Surprises
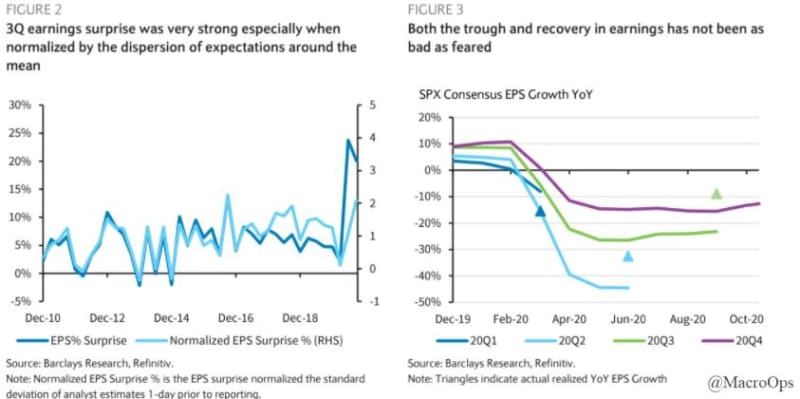
1. Earnings and economic data continue to surprise to the upside. Barclays notes that “the magnitude of the 3Q surprise is especially remarkable if we normalize the surprise by the dispersion of consensus expectations around the mean, which was quite high for 2Q.” You’d think with consecutive positive beats and surprisingly good vaccine news that analysts would have rerated their expectations significantly higher going into Q4, but you’d be wrong.
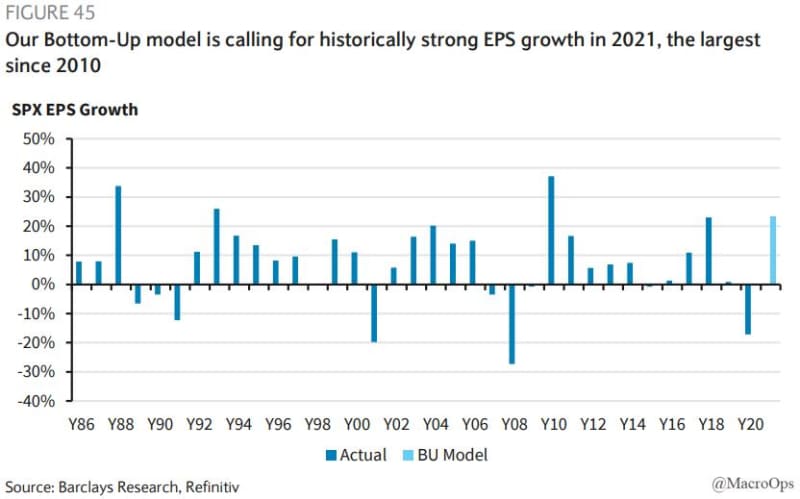
According to Barclays, they’re still setting a terribly low bar while the bank’s earnings models project Q4 and subsequent quarters will see very strong earnings growth.
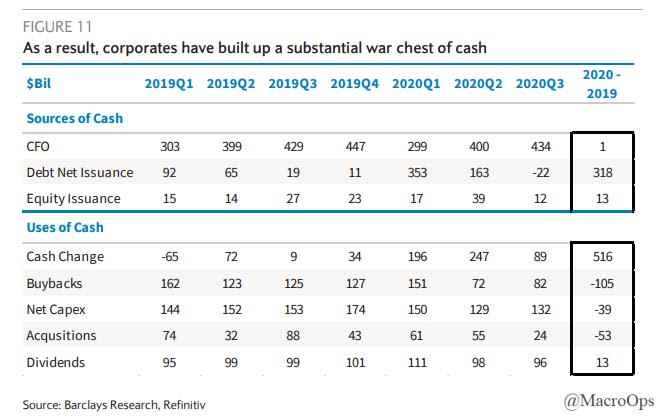
1. Buybacks are a critical input in our Equity Supply and Demand Equation. Buybacks were slashed this year for obvious reasons.
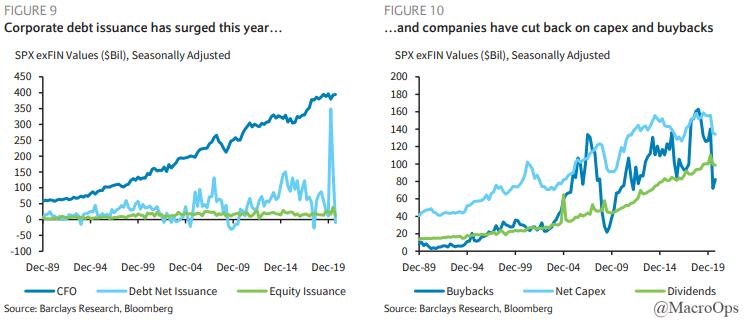
1. However, that’s likely to change going into next year as US corporates have built up a considerable war chest of cash.
The lack of scent
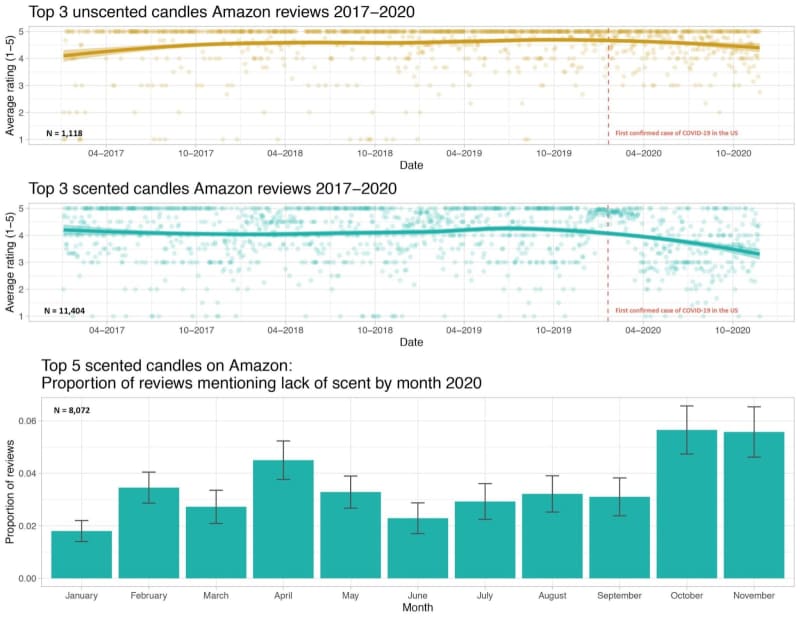
1. This chart is an amazing example of the explosion in niche data sets and what we can do with them. The below is from @kate_ptrv and shows the trend in customer reviews of scented candles on Amazon and mentions — or complaints, rather — of “lack of scent” over the last few years.
We can see that mentions of lack of scent have ebbed and flowed throughout the year, following the rise and fall in COVID cases (a common symptom of COVID is losing one’s sense of smell).
Pretty incredible stuff. And I don’t know about you but seeing stuff like this makes me love our bullish memory/data storage thesis even more… (h/t @Fritz844).
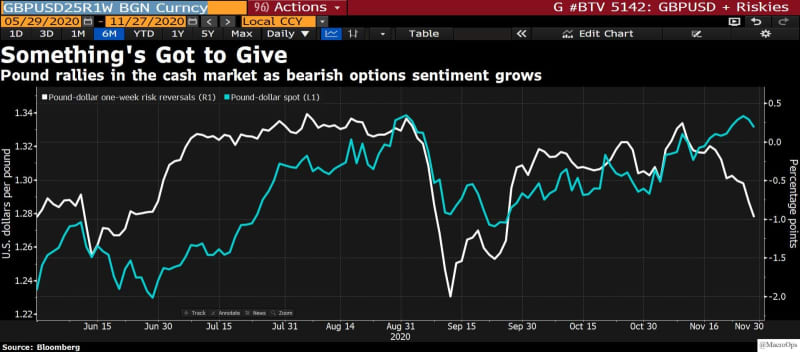
1. The dollar keeps breaking critical levels as it continues to drop.I don’t expect anything to arrest this fall until we see an intermediate-term top on this move in stocks, which I think is probably around a month or so away. Risk-reversals, which often have a big lead, are already paving the way.
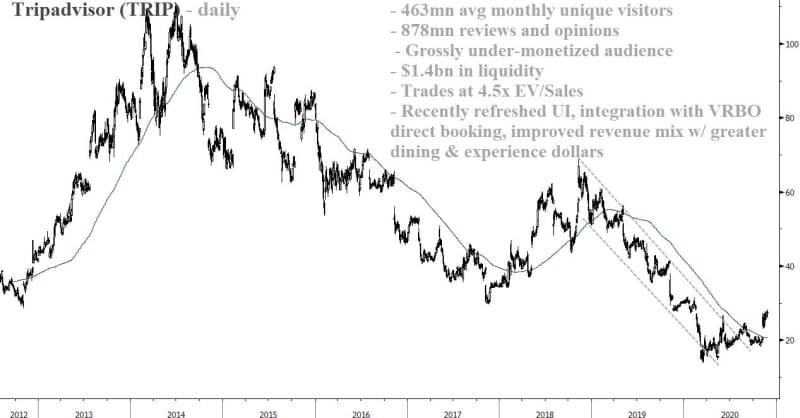
1. Tripadvisor (TRIP) to me is a lot like Twitter. An amazing product, captive loyal audience, extremely mismanaged.
This company has had endless opportunities and miles of a headstart to fortify its MOAT and monetize its massive user base. Yet, management has done… well, not much. And so the stock has perpetually suffered.
With that said, the company is cheap. It just did a full UI makeover that was an actual improvement. It’s integrated with VRBO and has greatly expanded its revenue mix with an aggressive move into dining and experiences.
COVID will be in the rear-view mirror next year and peeps want to get the hell out of their houses and travel. TRIP will benefit from that and they have plenty of liquidity to keep things going until then.
I don’t have a lot, or rather any confidence in management’s ability to let this golden goose hatch without accidentally chopping off its head. But… maybe they surprise us… and maybe the stock is just so cheap that even they can’t drive it lower… and maybe… well, that’s it.
Stay safe out there and keep your head on a swivel.
About the Author
Co-Founder of Macro Ops. Alex is a former US Government Counterintelligence Professional, U.S. Army Interrogator, and USMC Scout Sniper. He’s an independent trader with over 10-years in markets.
The post The Correction In Gold Is Not Over [Charts] appeared first on ValueWalk.