Bonhoeffer Fund commentary for the first quarter ended March 2021, providing a case study on Consolidated Communications Holdings Inc (NASDAQ:CNSL).
Q1 2021 hedge fund letters, conferences and more
Dear Partner,
The Bonhoeffer Fund returned 13.8% net of fees in the first quarter of 2021 compared to 4.2% and 8.1% for the MSCI World ex-US and the DFA International Small Cap Value Fund, respectively. As of March 31, 2021, our securities had an average earnings/free cash flow yield of 13.1% and an average EV/EBITDA of 4.7. By comparison, the DFA International Small Cap Value Fund, Bonhoeffer Fund’s closest benchmark, had an average earnings yield of 9.0%. These multiples are higher than at year end primarily due to replacing slower-growing securities with higher-growth securities. The difference between the portfolio’s market valuation and my estimate of intrinsic value is still large (greater than 100%). I remain confident that the gap will close over time and the portfolio quality will continue increasing as we increase allocations to faster-growing firms. If you are considering adding to your investment, then now would be a good time to put additional capital to work.
Bonhoeffer Fund Portfolio Overview
There have been small changes within the portfolio in the last quarter. As described in our year-end letter, historically, our annual portfolio turnover rate has been low—less than 15% since inception. Our investment universe has expanded from value-oriented special situations to include growth-oriented firms using a value framework. Value investing is investing in assets that are priced for less than they are worth. Growth is a key input into what an asset is worth. A significant uncertainty is how much cash-flow growth in the future will differ from the cash-flow growth in the past. If you focus on firms with simple business models and large amounts of recurring revenue, then this uncertainty can be reduced quite significantly and predicted with above-average accuracy. Thus, the growth-oriented firms we own are distribution, consumer product, or telecom/media firms that have high recurring revenues. Including both predictable growth firms with value special situations (our traditional fare) will allow the fund to continue to do well regardless of which strategy is favored by the market at any given time.
As a result of this extension, throughout the first quarter, we sold securities that have low-single-digit growth rates and sell for single-digit earnings multiples in order to invest in watchlist firms with growth rates in the mid-teens and earnings multiples in the low-teens. Therefore, as more growth-oriented companies have become available at reasonable prices, we have advantageously pursued these opportunities. We sold a portion of one of our cement firms and purchased a faster-growing homebuilder that is in the process of a spinout. Our largest country exposures include: South Korea, United States, Italy, United Kingdom, South Africa, and Hong Kong. The largest industry exposures include: distribution, telecom/media, real estate/infrastructure, and consumer products.
We’ve seen nice progress in our Korean and Hong Kong holdings, as these countries continue to effectively deal with the COVID virus. The greatest challenges have been in Latin America and South Africa, where COVID has not been dealt with effectively. These countries have less-developed health care infrastructures with slower distribution and immunization rates and cultures/jobs that require more face-to-face contact. The effects of COVID on these developing-country economies have been stifling to growth. Given the delayed production and logistics associated with the vaccines, I estimate recovery in these regions will occur in 2022, thus providing us an opportunity to invest in deferred (versus developed countries) COVID recovery situations. Governance is good and improving in our South African and Latin American holdings and, in my opinion, the current pricing more than reflects the governance situation in Hong Kong. Since my last letter, we have added a position in a UK-based homebuilder with recurring revenues.
Compound Mispricings (49% of Portfolio; Quarterly Average Performance +11%)
These securities include the Korean preferred stocks, the nonvoting share of Buzzi, Telecom Italia, and Wilh. Wilhelmsen, and some HoldCos. The thesis for the closing of the voting, nonvoting, and holding company gap is better governance and liquidity, and corporate actions like spinoffs, sales, or holding company transactions and overall growth.
As discussed in our last letter, we continue to review our compound mispricings and will look to sell where the discount is small and there are no ongoing actions to unlock value. Going forward, we will examine the potential share price increase due to the reduction in the discount over the next five years in comparison to the potential share price increase five years from now in faster-growing investments that I continue to monitor.
An example of one of our compound mispricings which has current corporate actions is Telecom Italia (TI). TI is a legacy telecommunications services firm in Italy that has used corporate actions to unlock value. Examples of this include a spinout/sale of its towers unit (Inwit), contributing its network to a joint venture with Open Fiber, a partially state-owned fiber network, and KKR to build the largest Italian fiber-optic backbone, and a joint venture with Google for data-center services (Noovle). The remaining assets include one of the largest phone businesses in Brazil and TI’s domestic fixed-line retail business. The Brazilian telco market is going through consolidation with the purchase of Oi’s assets by its competitors (América Móvil, TI, and Telefónica). This will result in Brazil downsizing from a fourcompetitor market to a three-competitor market. In addition, the Italian government has provided vouchers to lower-income Italian citizens for the purchase of broadband services and has provided funding for schools to connect to fiber networks and lay fiber in the “grey” areas, where high-speed coverage does not currently exist. The EU recovery fund has also earmarked about €40 billion to improve Italy’s digital initiatives. These initiatives should provide a favorable tailwind leading to increased service revenues going forward, in turn leading to 2.5% EBITDA growth in Italy and 4% in Brazil. This should transform TI from a declining-revenue/EBITDA business to a growing-revenue/EBITDA business. If this happens, the EBITDA multiple for TI should increase along with its EBITDA.
The Korean preferred discounts in our portfolio are still large (20% to 37%). The trends of better governance and liquidity have reduced the discount in names like Samsung Electronics, and more preferred names trade at a premium to common shares. We are seeing progress in another preferred stock we recently purchased in a Korean HoldCo transaction in the engineering and construction (E&C) industry.
Public LBOs (33% of Portfolio; Quarterly Average Performance +18%)
This includes our broadcast TV franchises, leasing and roll-on/roll-off (RORO) shipping, and our natural gas pipeline firm. One trend in these levered firms is the investment/innovation in growth areas.
An example is Wilhelm Wilhelmsen (WWI), our shipping company. The CEO of WWI committed suicide last spring, and there were some attempts by family members to remove the son of the former CEO who is now the current CEO. These attempts did not succeed. Meanwhile, WWI has been reducing its investment in Hyundai Glovis, a capital-intensive business, and investing in higher asset turnover businesses such as the joint venture (JV) to develop support and maintenance services for offshore wind farms called Edda Wind. This JV is in the process of going public via an IPO. WWI has also led initiatives to reduce the carbon footprint of its RORO ships by developing the first zero emissions RORO ship (Topeka) and a RORO ship that runs on hydrogen (Hyship). With a 50% global market share in the RORO shipping business and its ESG focus on the future of shipping, WWI should be re-rated to reflect these factors independent of the shipping cycle. In addition, WWI is also continuing to invest in the capital-light and high return on capital ship management business.
Distribution Theme (37% of Portfolio; Quarterly Performance +26%)
This includes our holdings in car and branded capital equipment dealerships, online shopping, and capital equipment leasing firms. One of the main KPIs for dealerships and shopping is velocity. We own some of the highest-velocity dealerships in markets around the world. There have been challenges in some markets hit by COVID, like South Africa and Latin America; however, there should be recovery now that vaccines have been approved and are being distributed.
Our UK car dealership, Cambria Automobiles, is in the process of receiving an offer to purchase the company by management for £0.80 per share. At this level, management can buy the company with the firm’s credit lines and a modest amount of additional debt. We believe, given the quality of Cambria’s franchise, that Cambria is worth £1.50 to £2.25 per share today, with a growing value over time. Since this type of takeover will require at least 75% shareholder approval and there are other shareholders who think this price is low also, we think that, to gain acceptance, the offer price will have to be increased or will remain independent
Telecom/Transaction Processing Theme (32% of Portfolio; Quarterly Performance +17%)
This includes our transaction processing and telecom firms. The increasing use of transaction processing in our firms’ markets and the rollout of 5G will provide growth opportunities. Given that most of these firms are holding companies and have multiple components of value (including real estate), the timeline for realization may be longer than for other firms.
For one of our telecom holdings, KT Corp, we are seeing signs of corporate actions (such as spinoff and JVs) in both foreign comparables (as described above for TI) and domestic competitors like SK Telecom, which recently announced spinoff plans for its non-telecom assets. As mentioned previously, KT has a treasure trove of non-telecom assets, like real estate and media content, that could be spun off. KT has also announced a share buyback of 5% of its stock and returning 50% of its net profits as dividends to shareholders, in addition to investing in growth strategies. In my opinion, these changes are not reflected in the current stock price.
Consumer Product Theme (12% of Portfolio; Quarterly Performance +3%)
This includes our holdings in consumer product, tire, and beverage firms. The defensive nature of these firms has led to lower-than-average performance due to the stronger performance of more recoverycorrelated names.
Real Estate/Construction Theme (27% of Portfolio; Quarterly Performance +20%)
This includes our holdings in real estate, residential construction, and cement firms. There has been a recovery in our Hong Kong name as the Hong Kong real estate market has begun to recover and its investments in Mainland China developer bonds continue to perform well. In my opinion, the pricing of our real estate holdings has been impacted by both a recession and the communist takeover in Hong Kong. The current cement and construction holdings (in US/Europe via Buzzi Unicem and in Korea via Asia Cement) should do well as the world recovers from COVID shutdowns and governments start infrastructure programs.
Korean Special Situation
Our current Korean holding company spinoff situation is playing out with both spun-off entities trading higher than the pre-spin prices. The spun-out construction company (DL E&C) is selling at a significant discount to other Korean E&C firms at 4x net income versus 6 to 11x for other Korean E&C firms despite having a higher ROE and operating margins versus other Korean E&C firms. The remaining company (DL Holdings) is also selling at a large discount to its parts. The spinoff should continue to allow for the rerating of DL E&C and DL Holdings.
Growing Firms in Fragmented Markets
As described in our last letter, we have incorporated a growth framework into our valuation process for selecting investments. This is an additional tool to be used in combination with our three existing frameworks (compound mispricings, mischaracterized firms, and public LBOs) which will undoubtedly enhance our investing process.
One book I recently read and reflected on was “100 Baggers” by Christopher Mayer.1 In this book, Christopher lays out common characteristics he has observed based upon his study of 100 baggers (stocks that have gone up over 100 times in price) from 1962 to 2014. Their common characteristics include:
1. a high return on capital business with the ability to re-invest profits;
2. growth; all of the companies were substantially larger at the end of the period than the beginning;
3. a reasonable price; he recommends not paying more than the sustainable annual growth rate or price/earnings growth (PEG) ratio of 1;
4. economic moats; these can arise from cost advantages such as economies of scale or scope and revenue advantages such as customer lock-in or network effects;
5. smaller firms, as they have longer runways to expand into;
6. owner operators, many of whom were fanatics and can add to conviction when challenges happen; and
7. needing time for compounding to work; typical time to 100x was 20 to 25 years (20% to 26% annualized).
If you combine numbers two and three from the list above, then it can form a “Davis double” with both cash flow growth and multiple expansion. Also, in addition to the PEG ratio, a reasonable value can be estimated using growth stock valuation models like the Graham Formula, which we have used in the past, to estimate enterprise and equity valuation. Growth can also be enhanced and moats built by consolidating industries resulting in economies of scale and scope.
Given the importance of growth, it is necessary to examine and understand the drivers of corporate growth over time. There are three ways that companies can grow revenues and profits over time, by:
1. being in a growing market;
2. consolidation in a market (which typically includes economies of scale and scope); and/or
3. technology creating a new market from an existing market.
We have focused on consolidation in slow-changing markets and situations where the incumbent can adopt an innovation without destroying its own business model. We examine opportunities by discretely modeling the revenue and earnings/free cash flows five years forward and examining the drivers (or KPIs) of the revenues and earnings/free cash growth and margins. This also includes understanding unit economics and how it can affect long-term growth prospects. Another area of importance is the operational leverage the business model provides as it is best to have earnings/free cash flow grow faster than revenue when fixed costs can be spread across a larger customer base.
Examples of this have been Ashtead and our case study this quarter—Consolidated Communications. In the case of Ashtead, the ability to grow has been enhanced by a fragmented equipment leasing market and adjacent markets that Ashtead can lease and sell products into (such as cleaning equipment) using the same infrastructure in leasing equipment (thus gaining local economies of scale). Ashtead can grow its cash flow at a rate of 15% per year (as discussed in previous letters) and is currently selling for 13x trailing free cash flow. In five years, 15% growth will generate 2x the free cash flows and, if this can be maintained for another seven years, then the multiple should be about 35 times. So, in this case, you can get a 2x via cash flow growth, and a 2.3x via increased multiple, for a combined upside of 4.6x. The key to these upside values is sustainable growth with margin expansion. These can be found in firms with growing franchises.
Consolidation increases the potential revenue growth of firms even in slow-growing or declining markets like the US local television market and Gray Television described in previous letters. Add in economies of scale and earnings growth rates in the low-teens become achievable in slow-growing market. If the market is also growing, then this adds an additional tailwind or margin of safety to the investment.
Conclusion
As always, if you would like to discuss any of the philosophies or investments in deeper detail, then please do not hesitate to reach out. Until next quarter, thank you for your confidence in our work and have a safe and fruitful spring and summer of 2021.
Warm Regards,
Keith D. Smith, CFA
Case Study: Consolidated Communications (CNSL)
Consolidated Communications Holdings Inc (NASDAQ:CNSL) provides local telecommunications services to consumers, businesses, and other telecommunications firms in the United States. CNSL provides legacy voice and data services and some fiber-based services to firms and individuals. Currently, CNSL has 780,000 voice subscribers, 76,000 video cable subscribers, and 792,000 data subscribers. In addition, CNSL’s network includes 46,000 fiber miles and has 20,900 on-net buildings.
CNSL is a rollup of local exchange carriers (LECs), some of which have rolled out fiber to their customers. CNSL acquired N. Pittsburgh Telephone (PA) in 2007, SureWest (CA and MO) in 2012, Eventis (MN, IA, WI, ND, and SD) in 2014, and FairPoint (ME, NH, MA, and VT) in 2017. As a result of these acquisitions and paying a high dividend, CNSL accumulated a large amount of debt. The firm is in the first year of a five-year fiber rollout where 1.6 million additional homes will be passed with high-speed internet (HSI) primarily in the Northern New England footprint. Currently, CNSL passed 400,000 homes with highspeed internet. Historically, the HSI penetration rates where fiber has been laid have varied from the high-30% to mid-40% range. In Northern New England (CNSL’s largest service area), most of the connections between and within communities are completed. The remaining connections/equipment are to connect individual residential and commercial customers to the network.
The company’s value proposition is to provide broadband services in suburban and rural markets. This service is provided for $45 to $75 per month depending upon speed. In most markets, CNSL has one competitor (81%) and in about 11% of the markets CNSL is the only provider. In the remainder of the markets, CNSL has two competitors.
CNSL’s last purchase was its largest, FairPoint. FairPoint’s main asset is legacy LEC lines acquired from Verizon Communications in Northern New England. FairPoint’s network was complete, but connections to end users required more network investment. Going into 2020, CNSL had two choices: (1) continue to slowly roll out its fiber to customers, or (2) find external financing to more quickly roll out its fiber to customers. CNSL chose the latter. After a search process, CNSL partnered with Searchlight Capital. Searchlight received 35% of CNSL’s equity and $396 million of preferred stock in return for $425 million of cash to accelerate the fiber rollout. Searchlight will also get a board seat. Searchlight has experience in larger fiber rollouts with some of its current investments.
Other larger incumbent LEC players (like Frontier Communications) are using the slow rollout approach as they are debt constrained. This approach results in continued revenue declines and a much more difficult task of converting existing broadband customers to their service. The CNSL thesis is a bet on a fully funded, quicker network rollout to reinvigorate CNSL’s organic growth. Other changes include hiring the former head of Google Fiber’s southeast region to lead the Northern New England rollout. Google Fiber has great customer service, as evidenced by the highest net promoter score (NPS) in an industry with poor NPSs overall. Management’s incentives have also changed in 2021 to include the fiber rollout metrics and other operational metrics like NPSs, in addition to revenue and operating profit growth.
Consolidation and Fiber-optic Rollout
The US rural and suburban telecommunications services market is a local, fragmented market. Consolidation has occurred over the past ten years amongst these local players and the next generation of technology (fiber-optic connections) is being rolled out. Fiber-optic rollouts are generating organic growth and economies of scale with high incremental user profitability. Consolidation can create economies of scale depending upon the geography of the acquired telecommunications firm. There is also the possibility of vertical integration across telecommunications services (like voice, data, cable, and hosting) in a given geography. With these rollouts, telecommunications companies compete with the local cable companies and, in some cases, wireless providers to provide HSI and other services to customers in their local footprints.
Historically, telecommunications and cable firms have had poor customer service, as evidenced by low NPSs. Keith Rabois, a founder of PayPal, has tweeted, “Formula for startup success: Find large highly fragmented industry w low NPS; vertically integrate a solution to simplify value product.” Part of simplifying the solution is providing multiple services and good customer service. The telecommunication services market fits this description. The new fiber rollouts are analogous to organic startups, and thus can also be successful in the vertical integration into these markets.
Business and Service Analysis
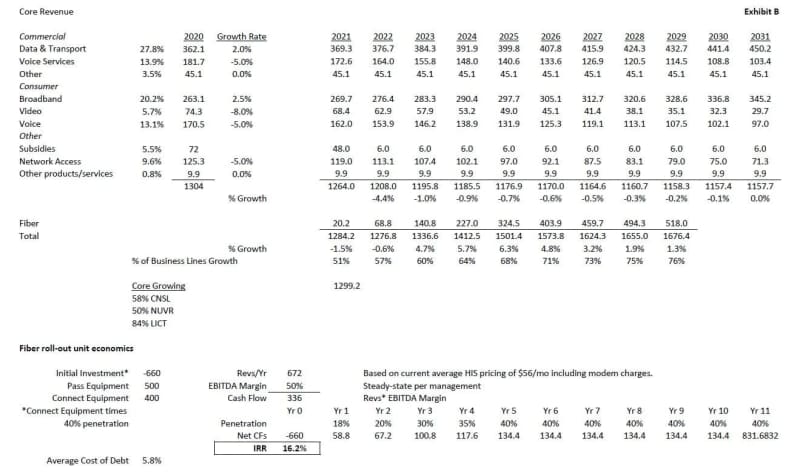
One way to look at telecom business is to divide it into growing and declining segments. Generally, data services are growing while voice, video, direct subsidies, and network access revenue are flat to declining. If you look at CNSL’s core data revenue, from both businesses and consumers (which is the growing part of the business), it represents 58% of revenue and grew by about 2.5% in 2020. The remaining segments are declining. As a benchmark versus other rural LECs (RLECs), Nuvera Communications (NUVR) has about 50% of its core revenue increasing while LICT Corporation has 84%.
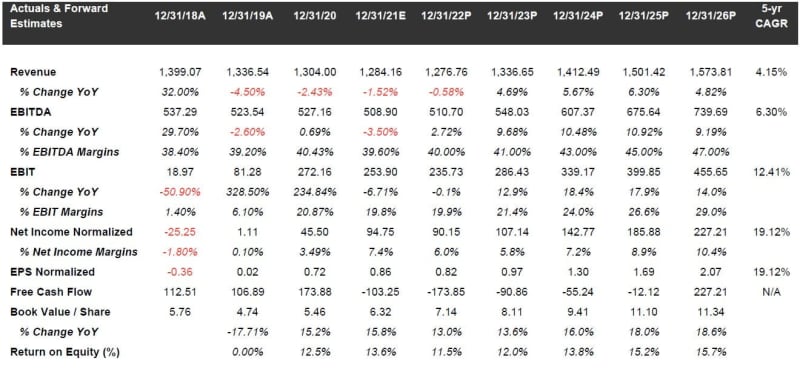
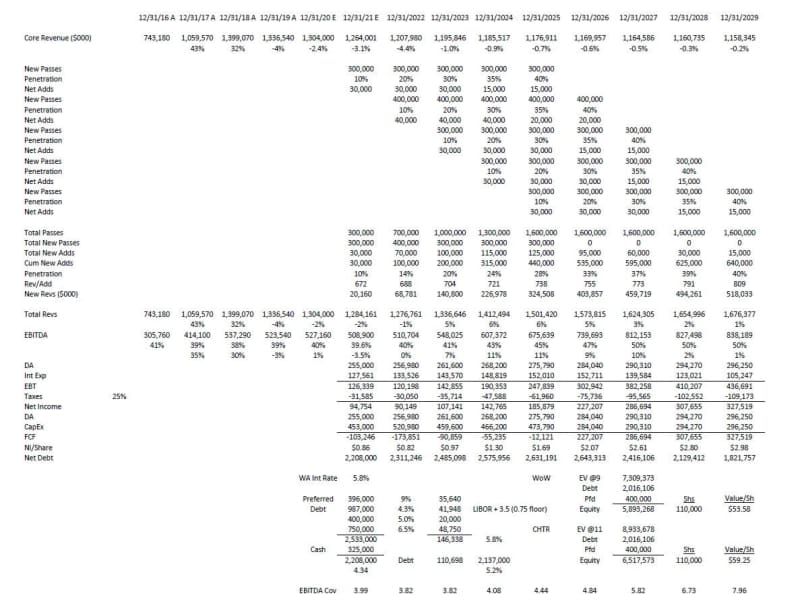
If we project CNSL’s segments out to 2031, the revenue decline rate will decline from -4.4% in 2022 to no growth in 2031. See Exhibit B. This is the situation with no accelerated fiber rollout. If we overlay the fiber rollout revenues on top of these numbers, then we see the advantage of rollout acceleration with increases in revenues. The rollout penetration assumptions are based upon management’s experience with broadband penetration given the local competitive environment (none, one, or two competitors). The timing of the rollout is based upon management’s fully funded rollout plan. Revenues on a composite basis start increasing in 2023 and grow going forward (from 1.3% to 6.3%). The portion of total revenue in growing segments will increase to 76% in 2031, versus 58% currently. Given the large, fixed costs in telecommunications services, increasing revenue leads to increasing margins. See Exhibit A for details.
If we look at unit economics of the fiber rollout, it is also quite favorable. The estimated cost to pass each new customer is about $500; and the cost to connect a customer is $400. If you have a final penetration rate of 40% using the current HSI monthly charge of $56/month, and a steady-state EBITDA margin of 50% (which management believes are achievable at scale; the current margin is 40% and a smaller RLEC comp LICT has a 45% margin), then the payback time is between six and seven years, and the unlevered IRR is 16%. See Exhibit A for details.
Local Telecom Market
The local telecom business in the US is a fragmented market on a national basis. The market is a local market, so many smaller markets only have a few competitors. For CNSL, most of their markets have one competitor (81%), no competitors (11%), or two competitors (8%). This leads to less price competition for CNSL than in more urban LECs where there are more competitors.
Since most of CNSL’s competition is from cable companies (that have low NPSs), CNSL has an opportunity to provide improved customer service versus the cable companies. This highlights the importance of hiring the manager from Google (who has the best NPSs in the cable business), the expertise of Searchlight in large-scale fiber rollouts, and including NPSs in management’s incentive compensation.
Of the other publicly traded smaller LECs, CNSL has the largest potential to increase organic revenues (by 30%) via a fiber rollout in its incumbent territories. This can be seen in the projections based upon the currently planned and financed fiber rollout shown in Exhibit B. As the rollout is completed, CNSL will have amongst the highest portion of segments with growing revenue when compared with other smaller LECs (LICT and NUVR).
Downside Protection
The Searchlight transactions allowed CNSL to extend the maturity of its debt to 2027 and lower its debt interest rate to 5.2%. CNSL has a decent amount of net debt and preferred stock at 4.3x EBITDA. The EBITDA coverage ratio is high at 4.0x which is projected to increase to over 5x by 2025 as EBITDA increases with the fiber rollout. This would imply a debt rating of between B and BB based upon these coverage and leverage ratios per the Strong Horse method described in “How to Make Money with Junk Bonds”2.
CNSL is in a defensive business—telecommunications services—which has a large amount of recurring revenue. Data revenues are increasing, while the legacy services are declining in volume. The crossover point to increasing revenues for CNSL will be 2023. See below for projections and Exhibit B for more detailed projections.
Management and Incentives
In 2020, the CEO’s management compensation was 20% base salary and 80% incentive based, of which 75% is equity based (CNSL shares) and 25% is cash based. The 2020 bonus compensation was 50% based upon an EBITDA target, 20% on net leverage, 20% on revenue growth, and 10% based upon qualitative targets. The 2020 equity-based compensation was 50% time-vested shares and 50% performance-based vesting. The performance-based vesting is based upon under or overperformance of CNSL versus an index of comparable firms. The 2020 equity-based shares were issued at $7.08 per share, and the 2019 shares were issued at $10.90 per share.
In 2021, the bonus will be based upon metrics focused on the fiber rollout including: FTTP penetration rates, FTTP passings for installs, adjusted EBITDA, revenue, and other operating metrics like NPS. The shares were granted in March 2021 and had an issue price of $6.31 per share. These incentives have a focus on rapid fiber network rollout in addition to revenue and EBITDA growth.
Overall, 1.1 million shares were granted in 2020 (about 1.0% of shares outstanding per year). The management team owns 1.6% of CNSL common stock. CNSL has stock ownership guidelines of 5x the salary for the CEO and 3x for other senior managers. Valuation
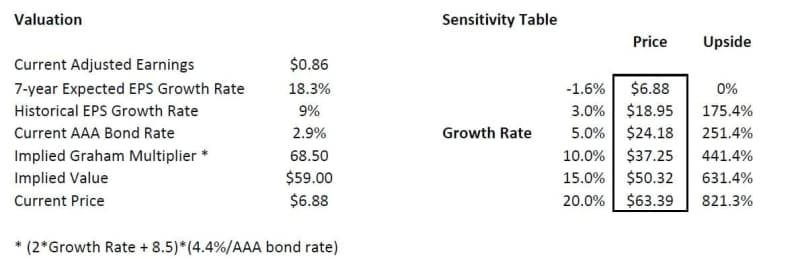
The valuation of CNSL is an interesting exercise because of the fact that its expected growth rate is accelerated by the fiber rollout described above. The implied growth using the Graham Formula adjusted to today’s interest rates ((8.5 + 2g)*(4.4/AAA bond rate)) and the current P/E is -1.6%, clearly implying the market expects that CNSL’s cash flows to continue to decline. Some benchmarks for growth are the projected sales growth rates of 4% per year (based upon the fiber rollout), EBITDA growth rate of 6% per year, and adjusted earnings growth of 19%.
The question is whether this growth rate is sustainable over the next seven years. Given the key penetration, margin, investment, and timing assumptions in the projection model, I believe it is. CNSL is the only US publicly traded telecom firm that has a rollout of this magnitude (adding 30% to revenue) scheduled over the next five to seven years. Two firms that have similar projected earnings growth to CNSL are Cincinnati Bell and Intred. Cincinnati Bell trades at a multiple of 34x, and Intred trades at a multiple of 24x. So a conservative 20x multiple on $0.86 EPS yields a value of $17 per share, which I believe is a reasonable 12-month target. If, over the five to seven years, a 19% EPS growth is attained, then the earnings will be $2.80. Applying a 23.8x multiple to these earnings (implying a 4% growth rate over the subsequent seven years) means a value of $67 per share is obtained.
Another way to look at valuation is on an enterprise basis. If we value CNSL on a forward EBITDA basis of 9x EBITDA (the current multiple of cable overbuilder WOW!), then the resulting value range is $52 per share. If we consider both benchmarks, then a $55 price target is not unreasonable. See Exhibit B for details. This results in a seven-year IRR of about 35%.
Comparables
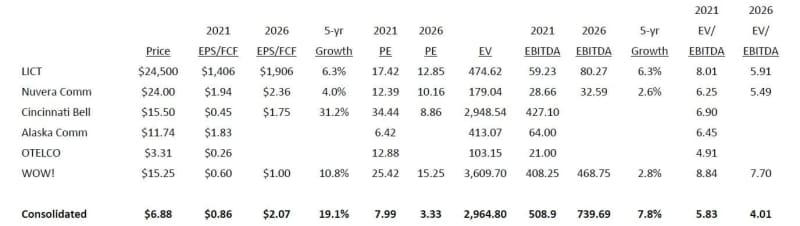
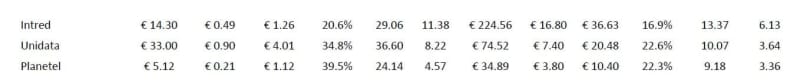
Given the fiber rollout and the size of CNSL, the comparable firms include US and Italian small-cap telecommunications firms. The following are the comparable firms in the US telecommunications and Italian telecommunications markets. The smaller Italian telecom firms have smaller floats than the US firms and are majority controlled (70%+) by the original owners.
There have been some private equity acquisitions in the US RLEC space, namely Cincinnati Bell and Alaska Communications. These firms have a similar dynamic associated with their respective fiber rollouts, and private equity firms have invested in these firms for similar reasons that make CNSL attractive. Cincinnati Bell has been purchased by the private equity firm Macquarie Infrastructure Partners, which outbid an original offer from Brookfield Asset Management. Alaska Communications is also in the process of being purchased by ATN International and Freedom 3 Capital. The EV/EBITDA paid by these buyers was 6.5 to 6.9x EBITDA for assets with lower margins than the current price of CNSL (5.8x EBITDA).
Comparable US Small and Mid-Sized Telcos
Small Italian Telcos
Benchmarking
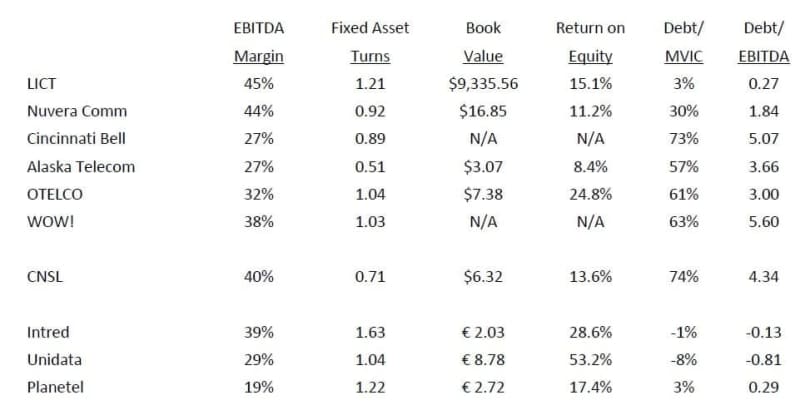
In comparison to other US and Italian firms, CNSL has below-average, but good, ROEs and a high EBITDA margin. CNSL’s fixed asset turns lag the other US and Italian firms. With CNSL’s fiber rollout and customer take-up, the fixed asset turns and ROEs should increase closer to the other US and Italian firms. With these favorable operational metrics, CNSL has one of the lowest current and 2016 P/E ratios of either group.
Risks
The primary risks to achieving a target valuation of $55 per share for CNSL include:
- a lower-than-expected broadband penetration of fiber rollout communities; and
- a quicker-than-expected decline in the legacy telecom lines.
Potential Upside/Catalysts
The primary upsides/catalysts include:
- faster-than-expected penetration of uptake of broadband services;
- operational leverage due to economies of scale; and
- re-rating to reflect higher growth.
Timeline/Investment Horizon
The short-term target is $17, which is more than double today’s price. I think the investment thesis can play out over the next three to five years. By that time, CNSL’s net income and earnings should have appreciated by more than two times, and the fair multiple could double with a 4% increased growth rate. If that is the case, then CNSL will attain an 8.0x return to $55 over five years. This is similar to a “Davis double,” where both underlying earnings increase along with the fair value multiple.
1. Chapter 15 “100 Baggers Distilled: Essential Principles” (p. 169-183), 100 Baggers, Christopher Mayer
2. p. 43-51, Chapter7, “The Strong Horse Method”, How to Make Money with Junk Bonds, Robert Levine
The post Bonhoeffer Fund 1Q21 Commentary: Consolidated Communications Case Study appeared first on ValueWalk.